Dendrobium Terrestrial Ecology
Monitoring Program.
Client: South32
Industry sector: Mining
Services: Ecology and biodiversity, Spatial Services
Location: Appin, NSW
About this Project
The project
As part of the Dendrobium Terrestrial Ecology Monitoring Program, our ecologists measure and monitor ecological values and indicators for Coastal Upland Swamps in the Sydney Basin Bioregion (Upland Swamps) listed as Endangered under the NSW Biodiversity Conservation Act 2016 (BC Act) and the Commonwealth Environment Protection and Biodiversity Conservation Act 1999 (EPBC Act).
“The Niche Spatial Services team are currently investigating exciting new multiple criteria analysis workflows to further automate the delineation of swamp boundaries using canopy height, canopy density and vegetation moisture index.”
Loren Laughlan, Experienced Consultant – Spatial Services, Bulli
Our role in the project
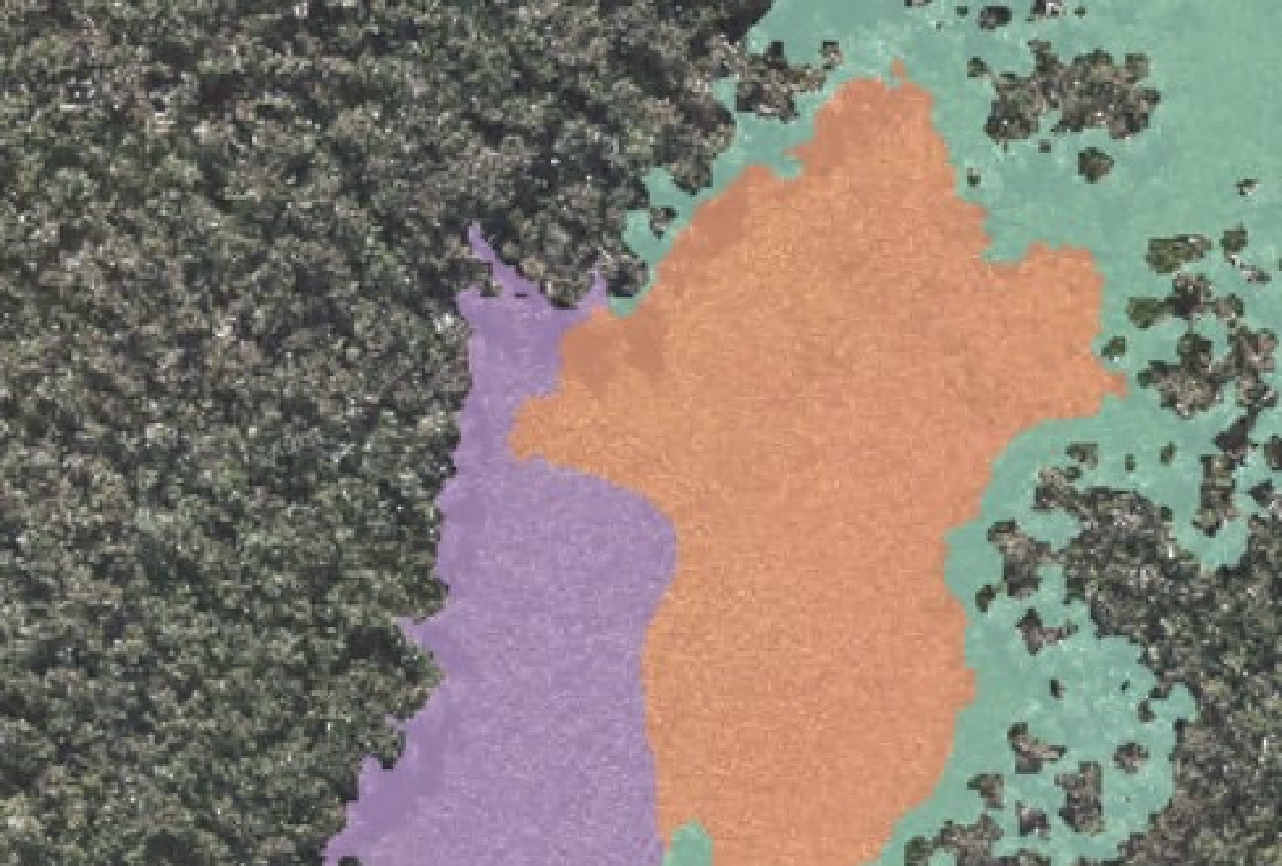
The Niche team conducted spatial analysis on LiDAR data received from South32 to detect upland swamp extents by first modelling swamp vegetation sub-community types based on a differential Canopy Height Model (CHM). The CHM classifies swamp vegetation by height according to specifications within The Native Vegetation of the Woronora, O’Hares and Metropolitan Catchments (NPWS, 2003) and on-ground experience. Vegetation sub-community boundaries were delineated from the data and verified with visual interpretation of high-resolution aerial imagery captured by an unmanned aerial vehicle (UAV). Calculations were run to determine the percentage of the swamp with vegetation height values greater than the known subcommunity limit.
The team also produced figures for the report that overlayed the results of the upland swamp LiDAR analysis extents with size of pool measurements and counts of tadpoles to determine species composition and total species richness.
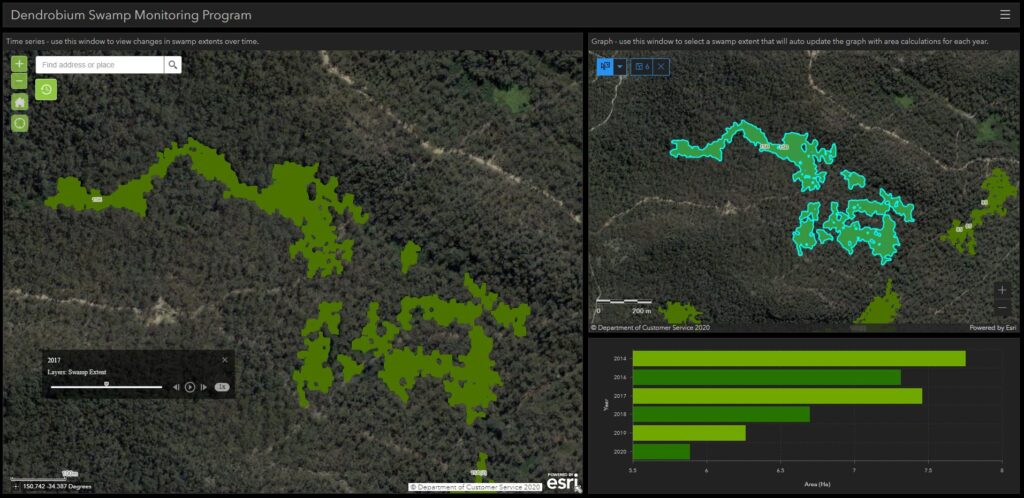
The Niche Spatial Services team ran the analysis workflow on LiDAR data spanning seven years, the duration of the monitoring program from its beginning. The team assembled the results of the analysis into an ArcGIS dashboard that enabled time series analysis for visualisation of swamp boundary changes over time and graphed the comparisons of swamp area across the seven-year span.
The development of a central, web-based ArcGIS dashboard has been integral in the sharing of information among the project team as well as with our client, South32. The dashboard enables the team to consume the results of the analysis in a new, more efficient and dynamic way.
The advantages we delivered to this project
- Spatial data securely hosted in ArcGIS Enterprise
- Streamlined field data capture workflows deploying the FieldMaps app
- In-house Spatial Services team specialising in the management of environmental and heritage data
Excellence in your environment
- Contact us to discuss how we can support your project.
- Read more about our expertise in Spatial Services and Environmental Planning, Approvals and Management.